



Theory of cyclic distillation technology
Cyclic distillation is a method for organising phase contact in column mass-transfer apparatus. It is a continuous process in which the liquid and vapour phases move through the column out of phase. The term “cyclic” refers to the cyclic nature of phase interaction on a single tray. Unlike conventional columns, in which vapour and liquid flow continuously and countercurrently, cyclic distillation employs Separate Phase Movement (SPM) using specialised tray internals, such as Maleta trays or cyclically operated perforated sheets. Each operating cycle consists of two alternating phases: the Vapor-Flow Period (VFP), during which the liquid remains stationary on the tray while vapour is fed upward through the column; and the Liquid-Flow Period (LFP), during which vapour flow stops completely, allowing the liquid to drain downward by gravity to the stage below in a coordinated and simultaneous manner. It should be noted that all physical laws and regularities inherent in conventional distillation remain applicable to cyclic distillation. The principal difference between conventional and cyclic distillation lies in the influence of the column’s hydrodynamic structure on component separation efficiency.
The basic design of distillation columns involves determining the number of theoretical trays and the reflux ratio. These two quantities are linked by the equilibrium line and the operating line. A theoretical stage is defined as a hypothetical device in which equilibrium is achieved between the vapor leaving the stage and the liquid remaining on the stage. The hydrodynamic model for both phases is the ideal-mixing model, in which liquid and vapour concentrations on the tray remain constant throughout column operation. The theoretical-stage model is adapted to actual column operating conditions using a single parameter: tray efficiency.
The next step in developing distillation theory was to examine how tray flow structure affects component separation efficiency. Theoretical calculations showed that, for overflow trays under ideal liquid and vapour displacement conditions, component separation efficiency significantly exceeds that of a theoretical stage. However, realising these advantages in conventional columns proved difficult.
The American scientist and inventor Michael R. Cannon first proposed cyclic distillation in the early 1960s. For ideal displacement of liquid and vapour on conventional trays (e.g., capped trays), where the independent variable is the liquid trajectory along the tray, the spatial variable in the differential mass-balance equation was replaced by time. The new independent variable was the vapour-flow period. This radically altered the hydrodynamic conditions for mass transfer on the tray and made it possible to achieve ideal liquid and vapour displacement under practical operating conditions.
The operating line in distillation is a straight line on a y–x diagram that describes the relationship between vapour composition (y) and liquid composition (x) in a given section of the column. Within the theoretical-stage concept, the operating line connects the vapour and liquid concentrations associated with a tray. No intermediate concentration values exist between these points. Geometrically, the operating line represents the locus of intersections between vapour concentrations rising from the lower tray and liquid concentrations on the upper tray. The coordinates of tray N on the operating line are given by N (Xn; Yn−1).
The theoretical-stage model of cyclic distillation, like the operating-line model of cyclic distillation, is based on the continuous change in component concentrations in the liquid and vapour phases on each tray and throughout the column as a whole. Calculating a cyclic distillation column involves solving a system of differential equations for the material balances of the individual trays, subject to the specified initial and boundary conditions. The component concentration profiles in the liquid and vapour phases obtained from the numerical solution for each tray are interpreted as an operating line, which is constructed as follows. Over the entire vapour-supply period T (t ∈ [0, T]), the component concentrations in the vapour and liquid phases are recorded at time intervals ΔT for each tray. The geometric interpretation of the cyclic-distillation operating line is a set of intersection points between the vapour concentrations rising from the lower tray and the liquid concentrations on the upper tray at a fixed instant of vapour injection. The component concentrations on the operating line of tray Ni are defined as Ni (Xni; Yn−1i).
When adapting the “theoretical stage of cyclic distillation” model to the column’s actual operating conditions, two parameters are used. The extent to which vapour approaches equilibrium is determined by the instantaneous efficiency E0. The conditions for liquid overflow from one tray to the next are characterised by the parameter F, which represents the fraction of liquid that overflows from the tray. Both parameters satisfy 0 < F ≤ 1 and 0 < E0 ≤ 1.
The column material-balance equation does not determine the actual number of trays required to achieve a specified degree of separation. Trays may differ in design and efficiency. The column may also be packed. Distillation can be centrifugal, film, or, ultimately, cyclic. In addition to the material balance, an equilibrium relationship and the hydrodynamic conditions governing phase interaction are required. Below is a graphical interpretation of the mathematical models used to describe the operation of a distillation column.
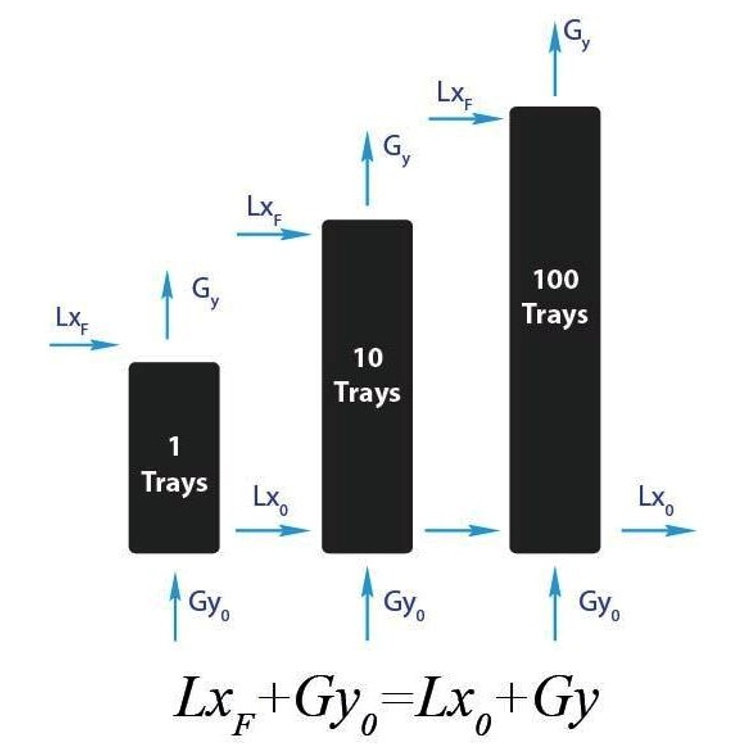
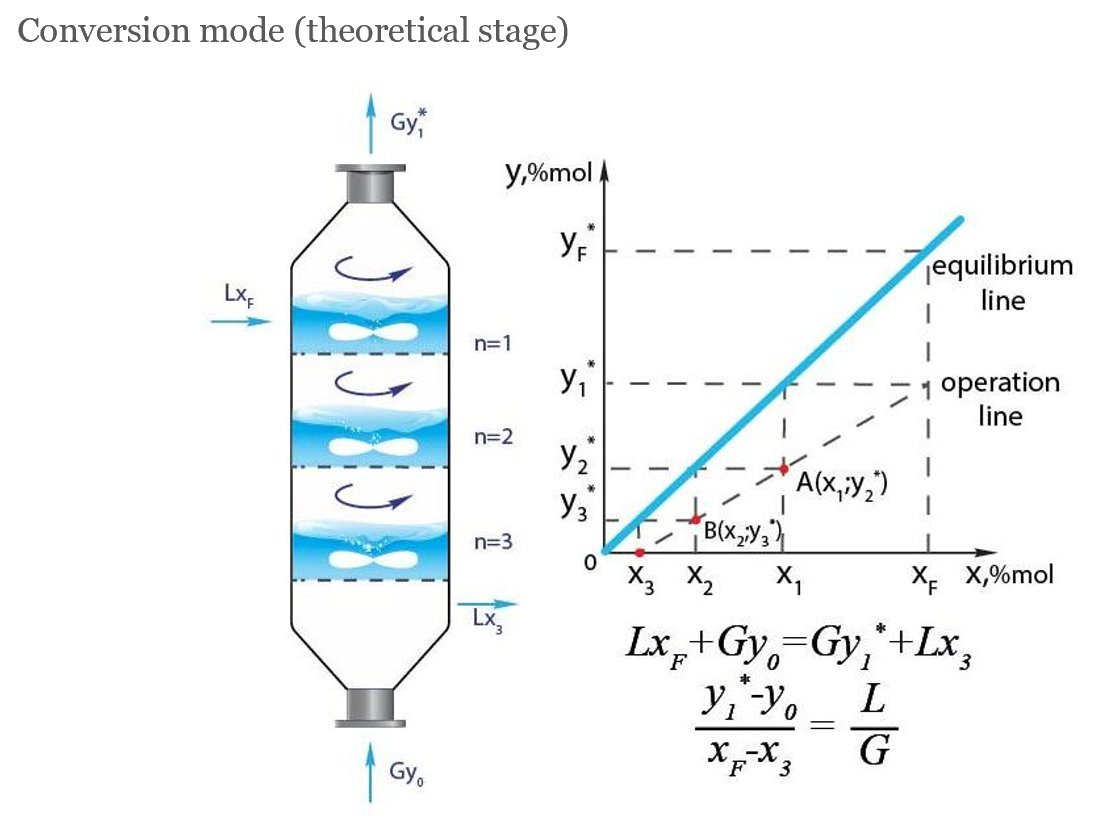
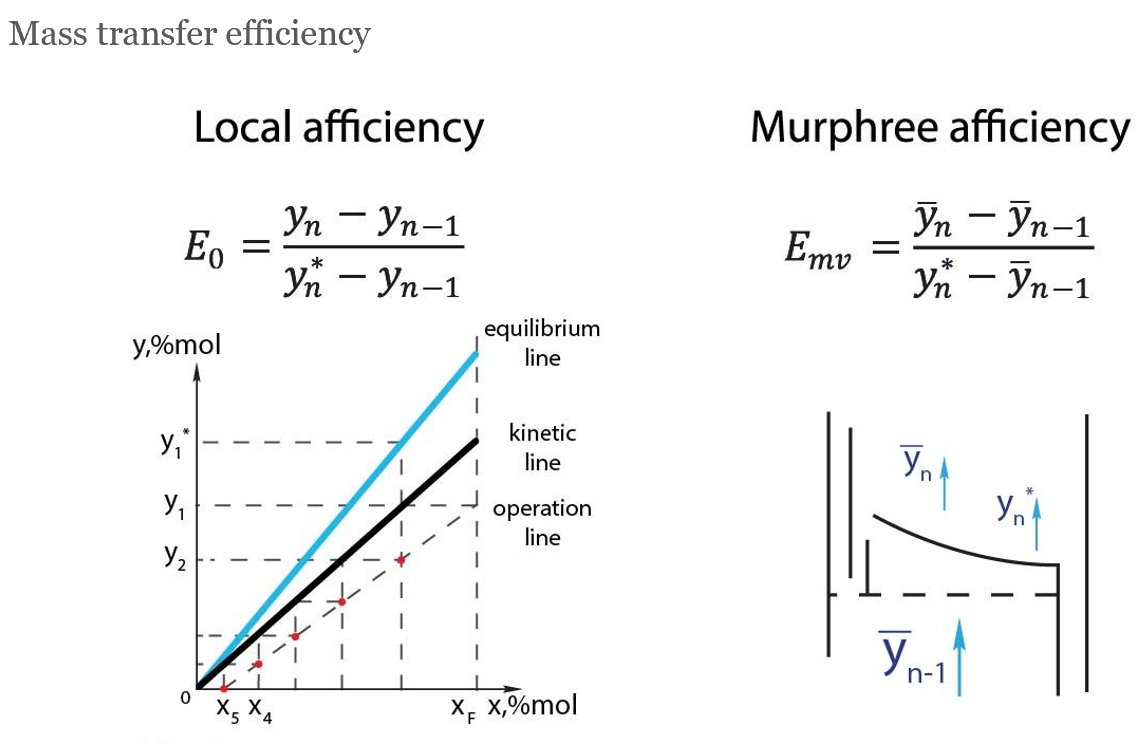
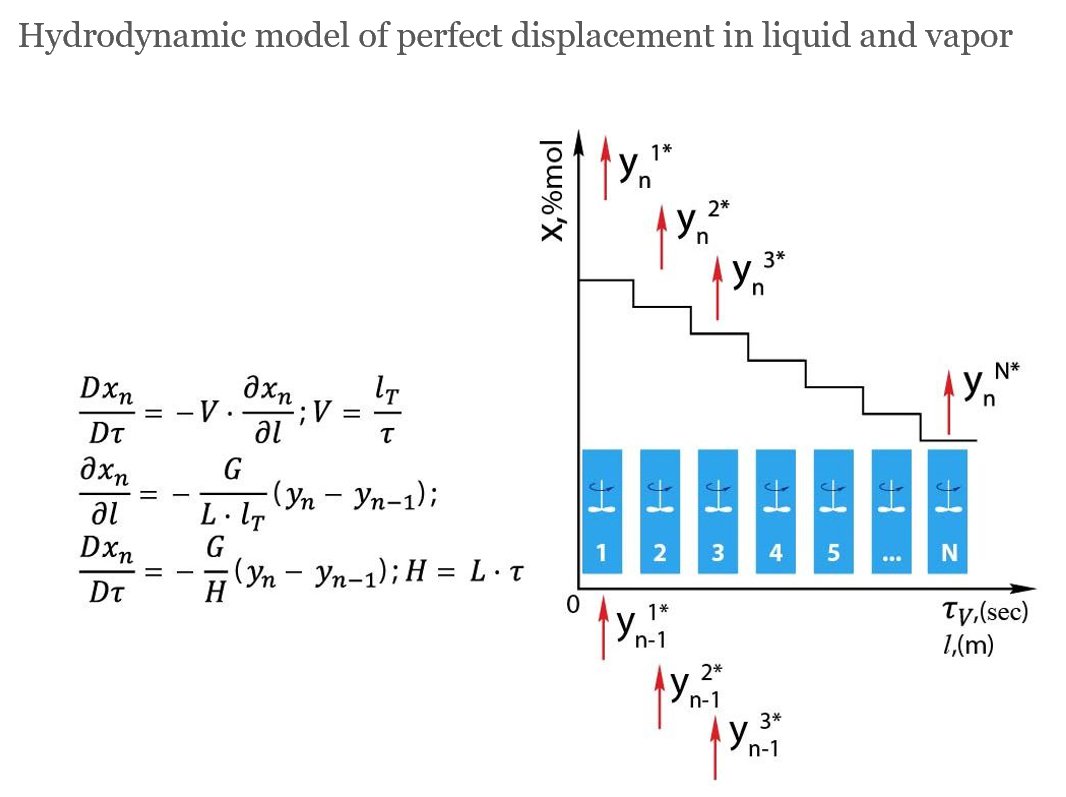
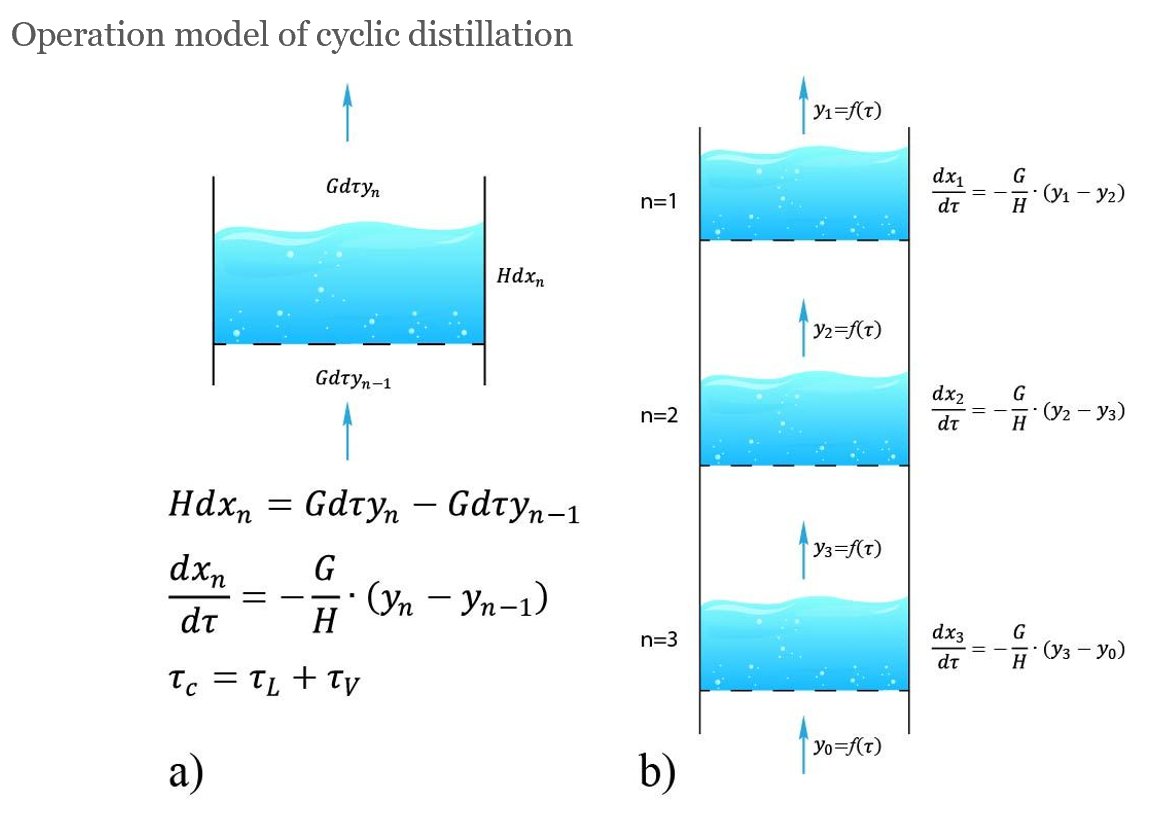
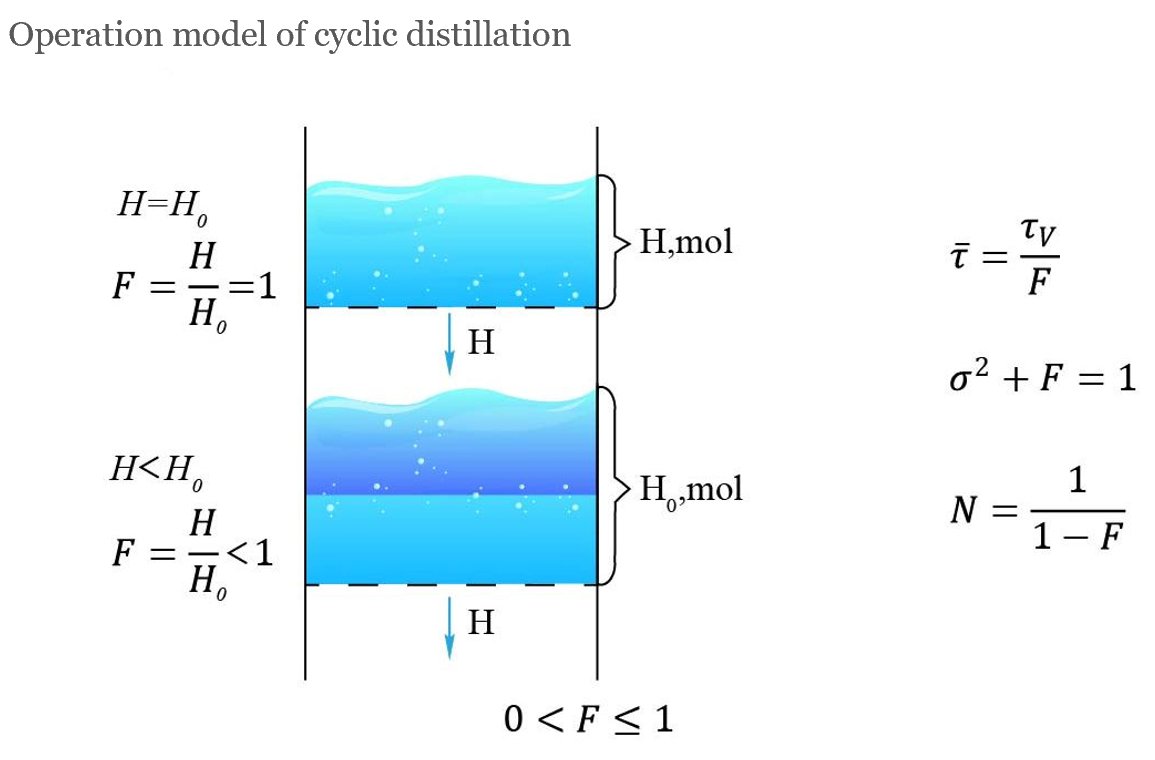
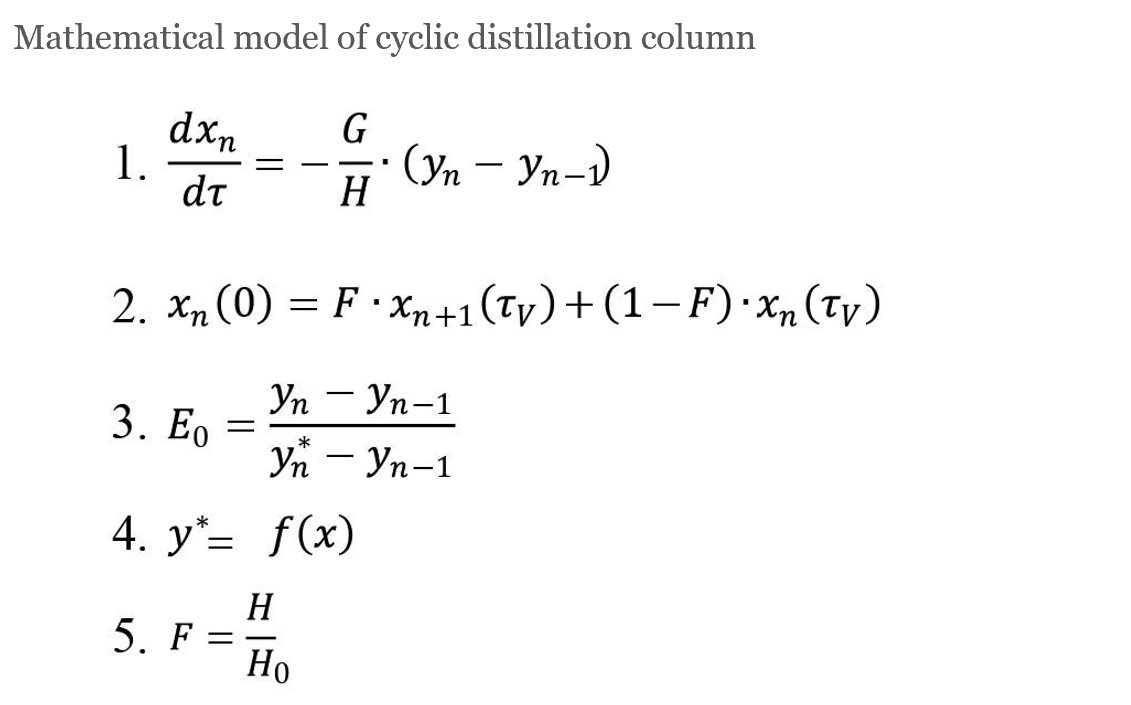
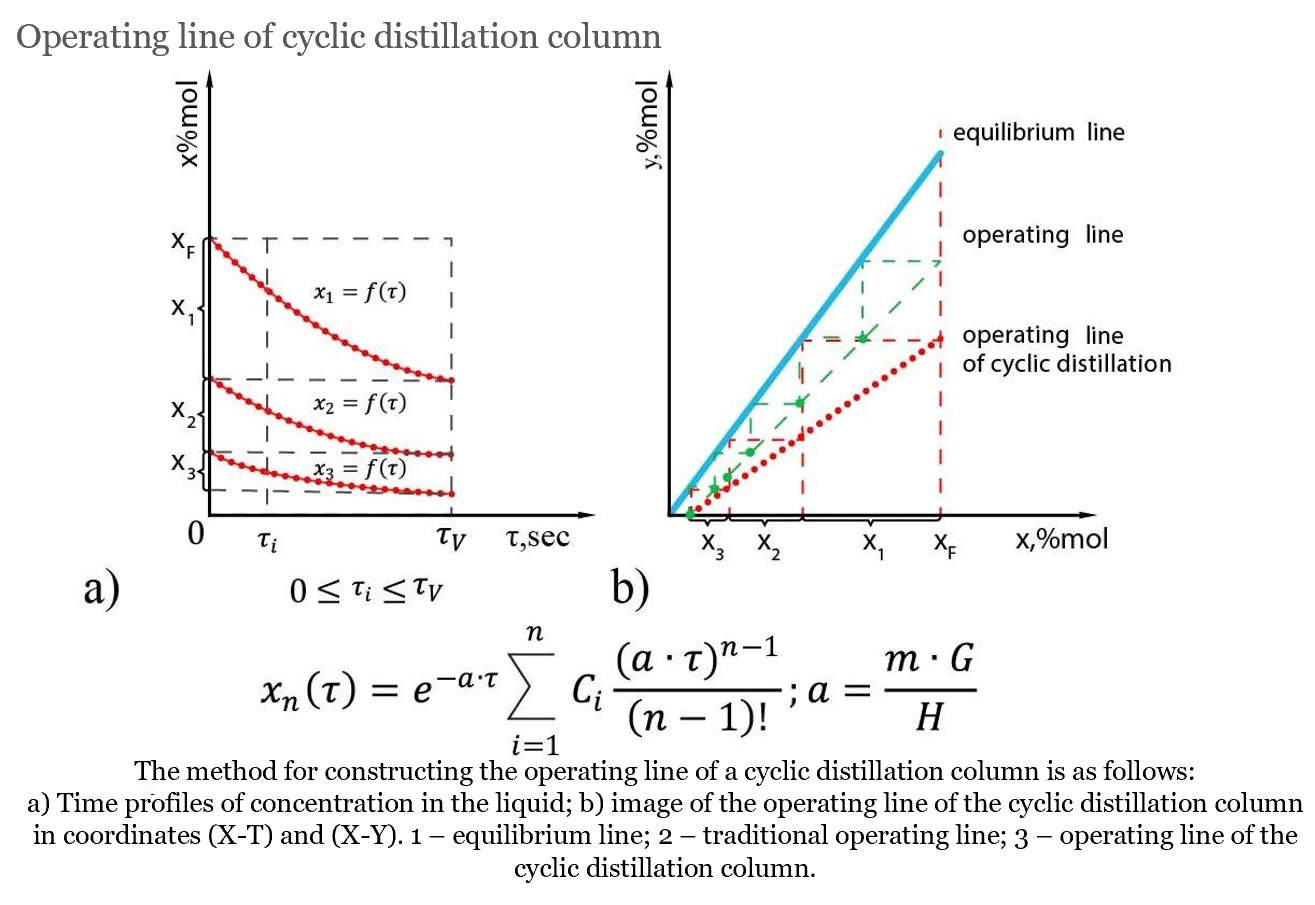
The geometric interpretation of the cyclic distillation operating lines for a stripping column is shown in Figs. 1–3.
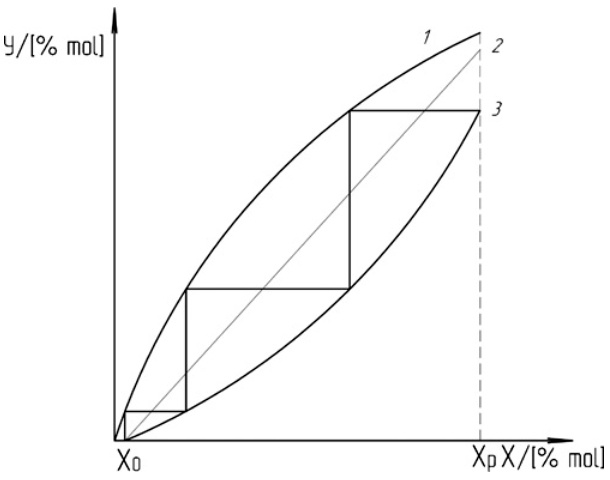
Fig. 1. Cyclic distillation operating line. (1) Equilibrium line, (2) conventional operating line (L/G),
and (3) cyclic distillation operating line (F = 1; E0 = 1).
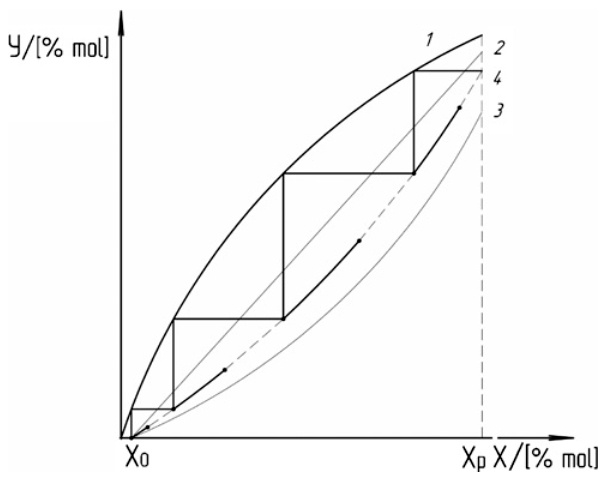
Fig. 2. Cyclic distillation operating line. (1) Equilibrium line, (2) conventional operating line (L/G),
and (4) cyclic distillation operating line (F < 1; E0 = 1).
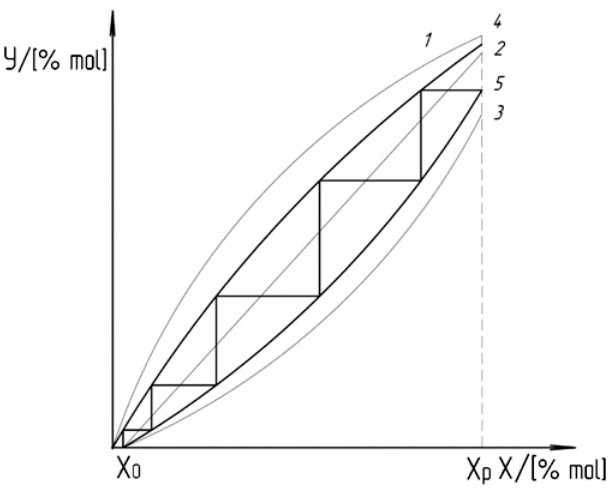
Fig. 3. Cyclic distillation operating line. (1) Equilibrium line, (2) conventional operating line (L/G),
and (5) cyclic distillation operating line (F = 1; E0 < 1).
The dependencies are illustrated using a cell model of fluid-flow hydrodynamics. The limiting values of F have the following interpretations. If F = 1, the mean residence time τ equals the vapour-injection time, the variance is σ² = 0, and the number of cells N → ∞, corresponding to ideal plug-flow conditions. Conversely, if F = 0, the mean residence time τ → ∞, the variance is σ² = 1, and the number of cells N = 1, corresponding to ideal mixing conditions. It is generally assumed that, for N ≥ 10, the flow regime approaches ideal plug flow. In the present case, this condition is satisfied for 0.9 < F ≤ 1.
To demonstrate the advantages of cyclic distillation over conventional distillation, we modelled a mixture of the isomers isobutanal and n-butanal using both a theoretical-stage model and a theoretical-stage model for cyclic distillation. The column calculation involved determining the number of cyclic distillation stages at different reflux ratios. The minimum reflux ratio was found to be R = 18.
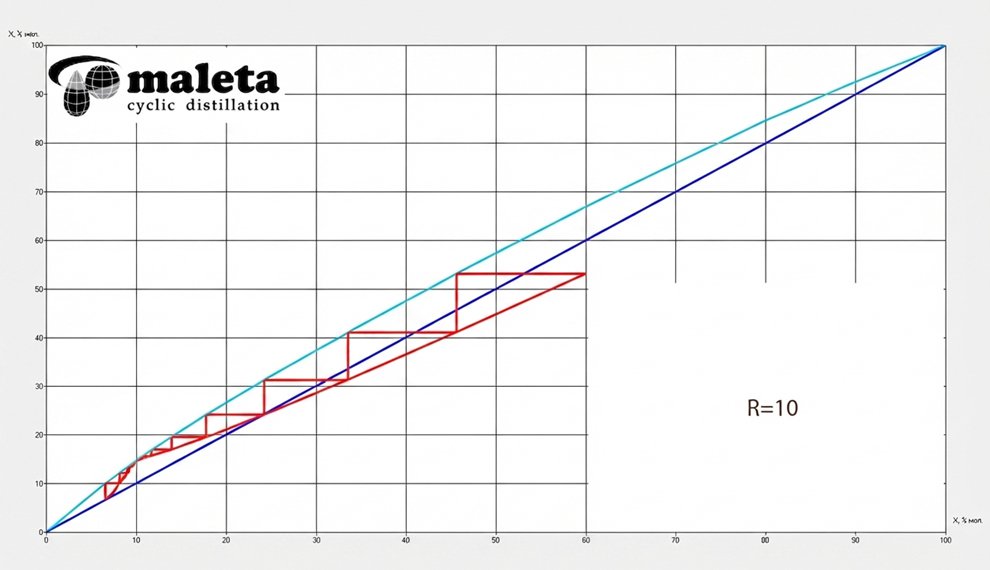
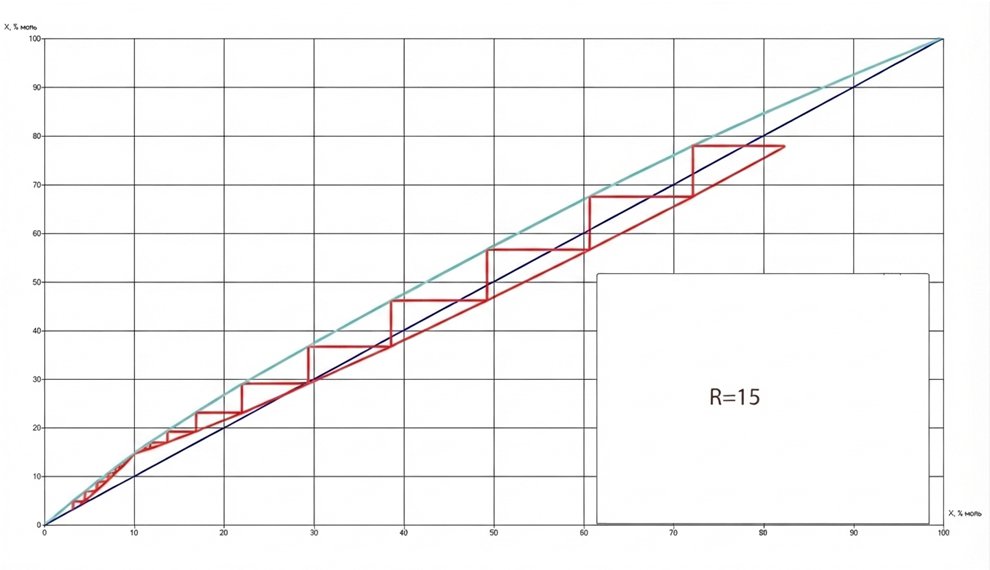
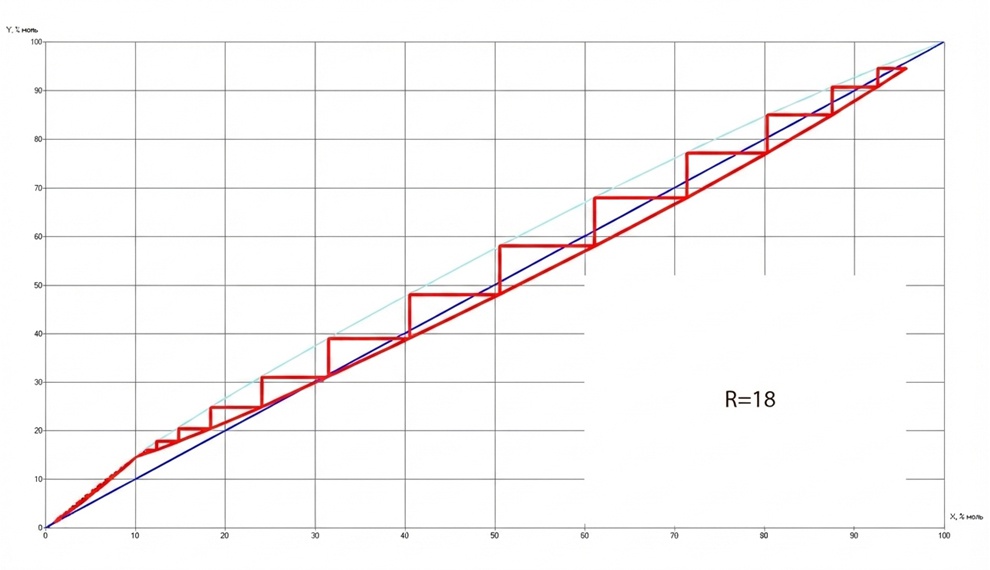
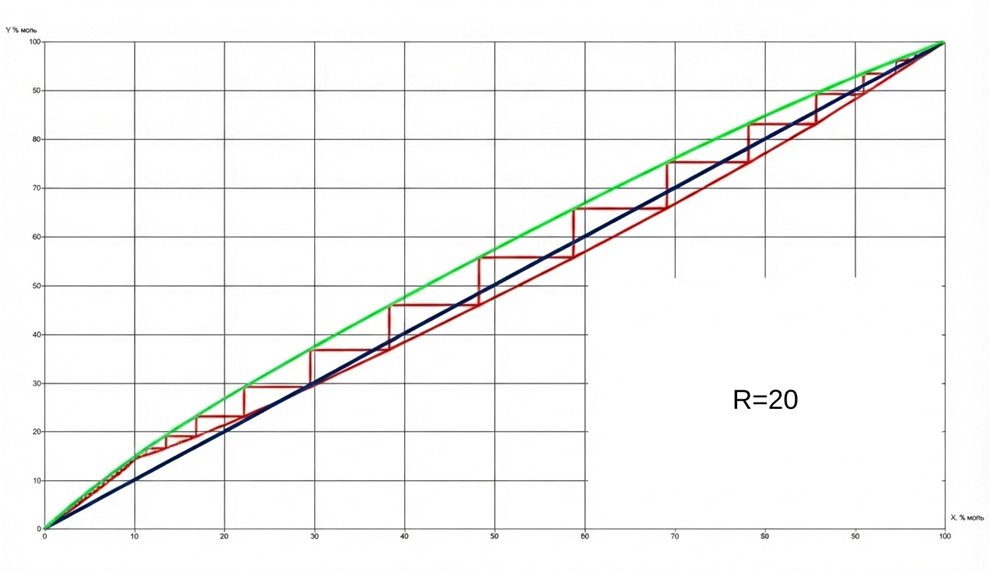
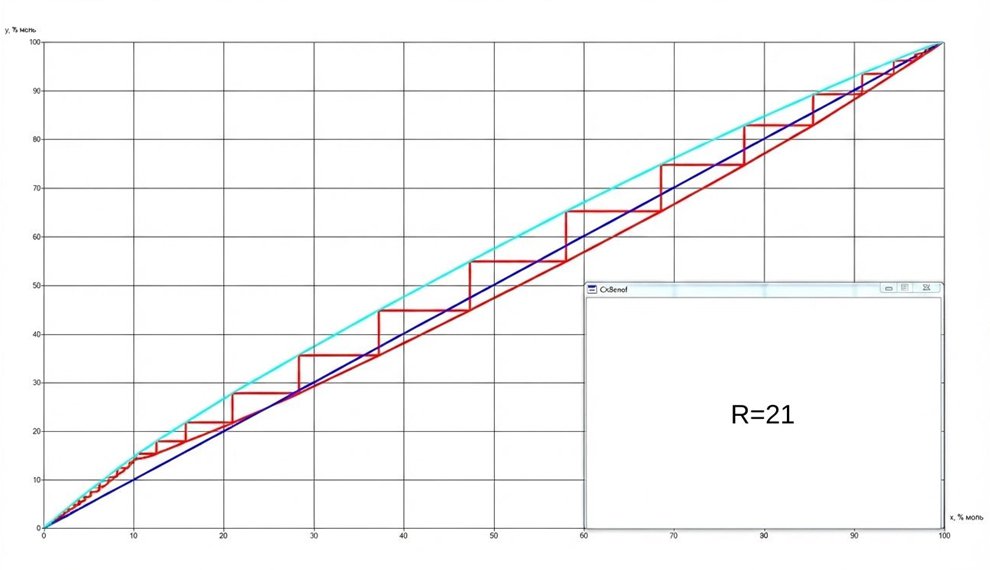
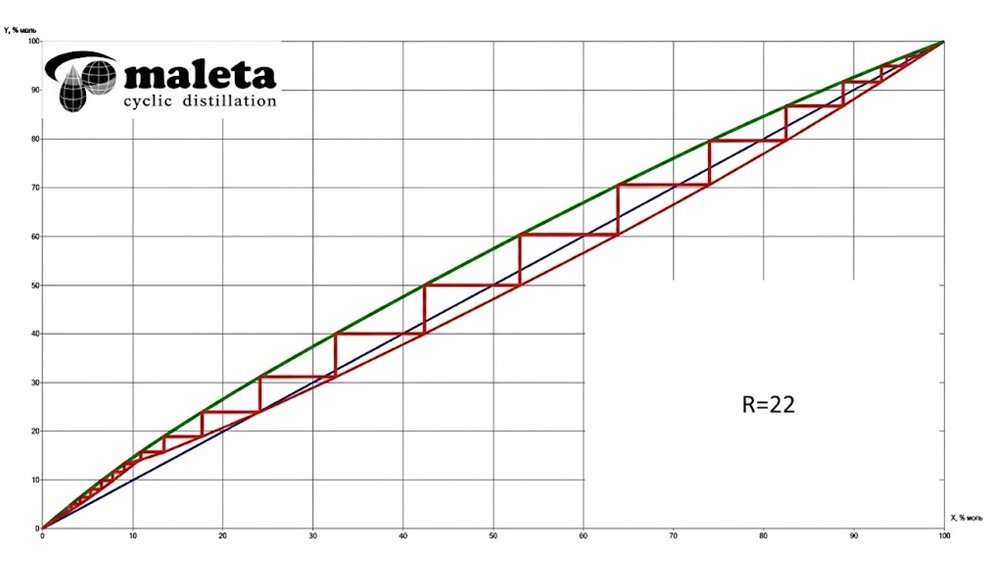
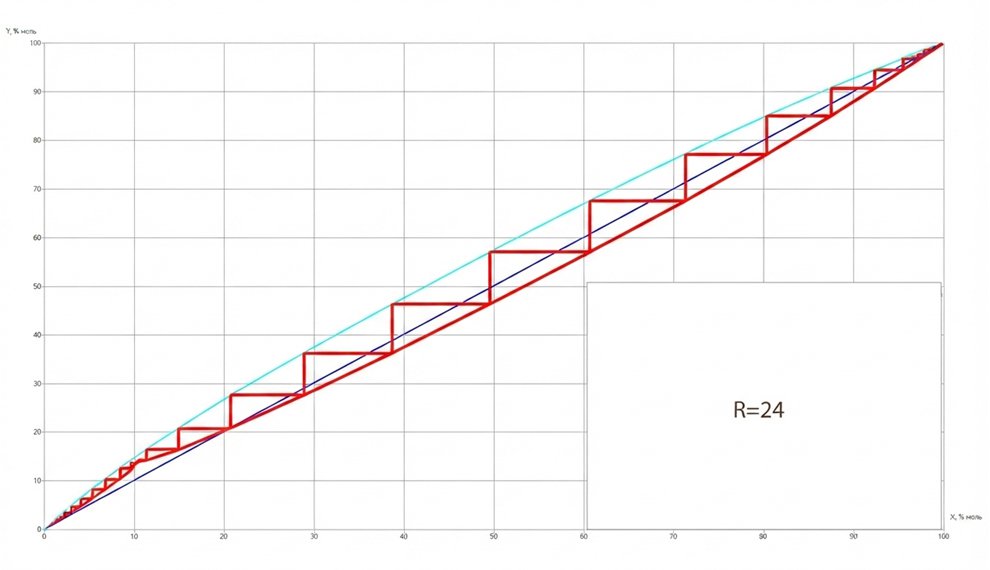
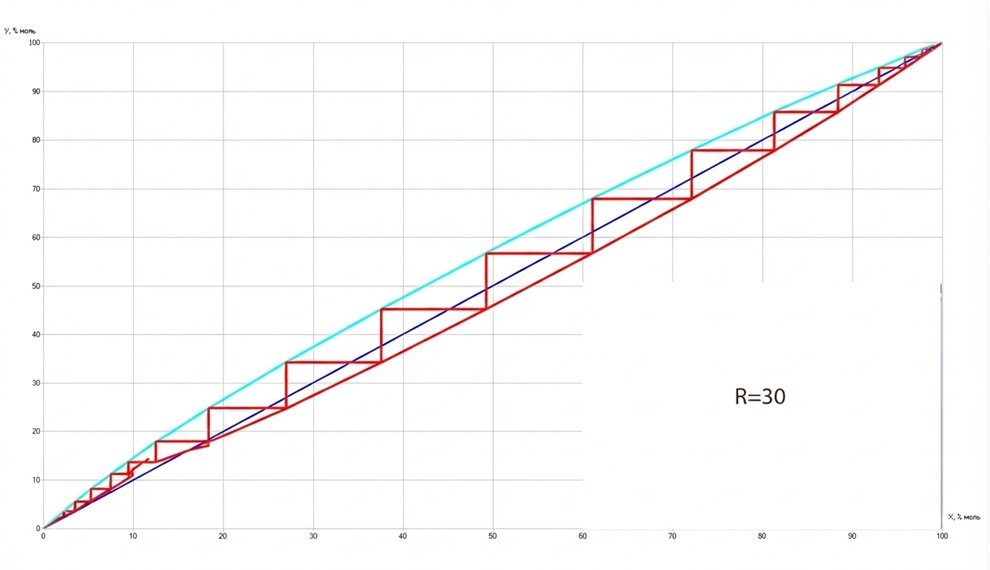
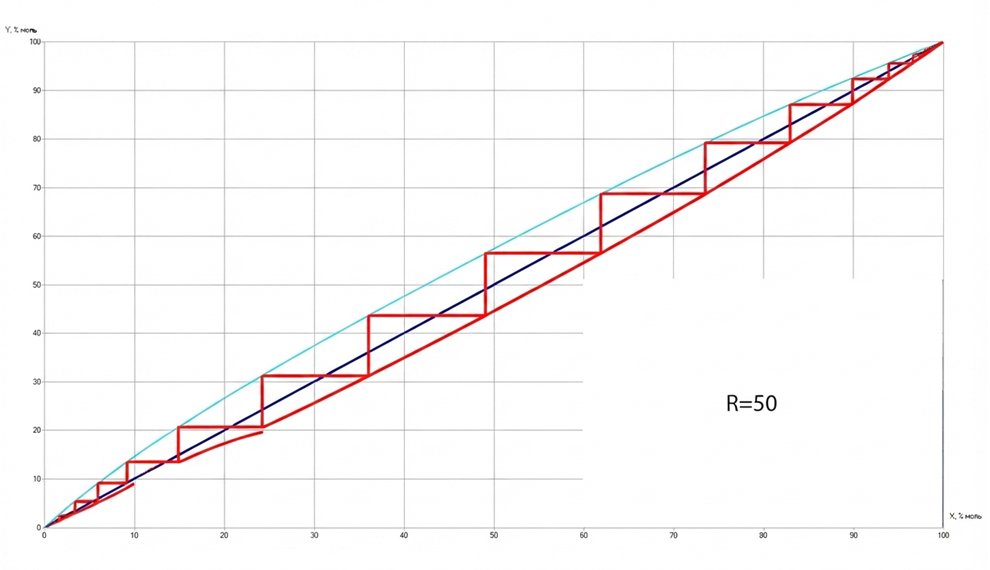
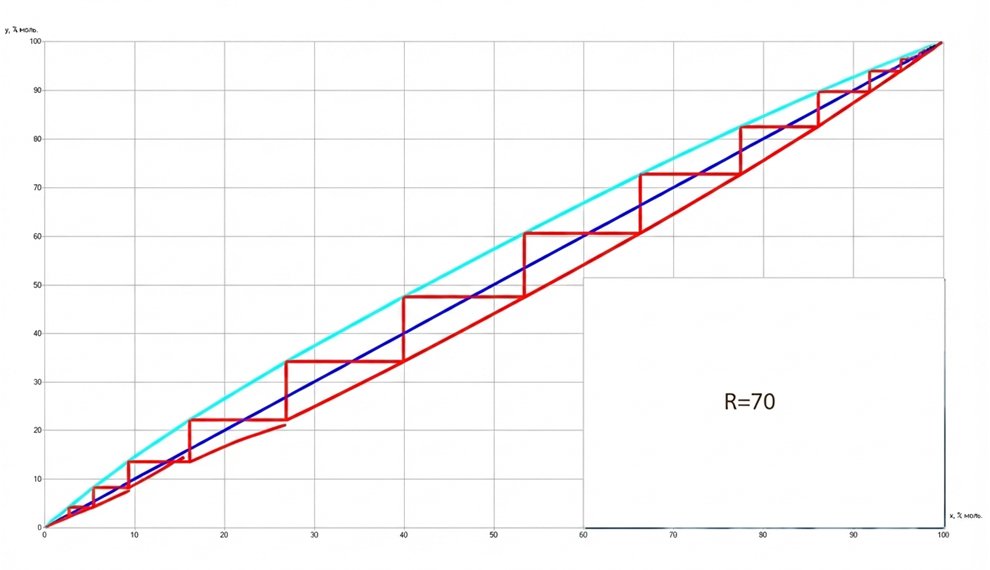
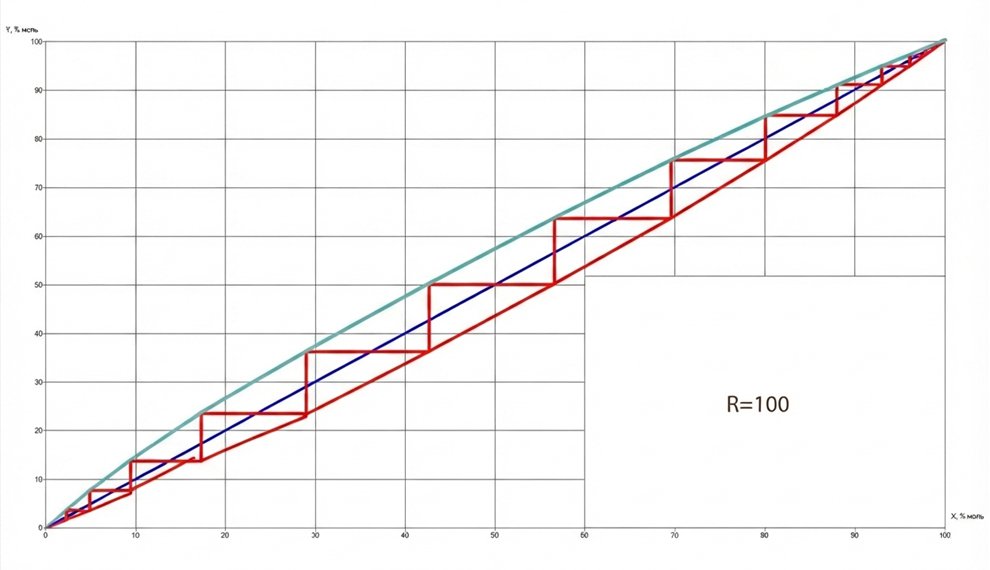
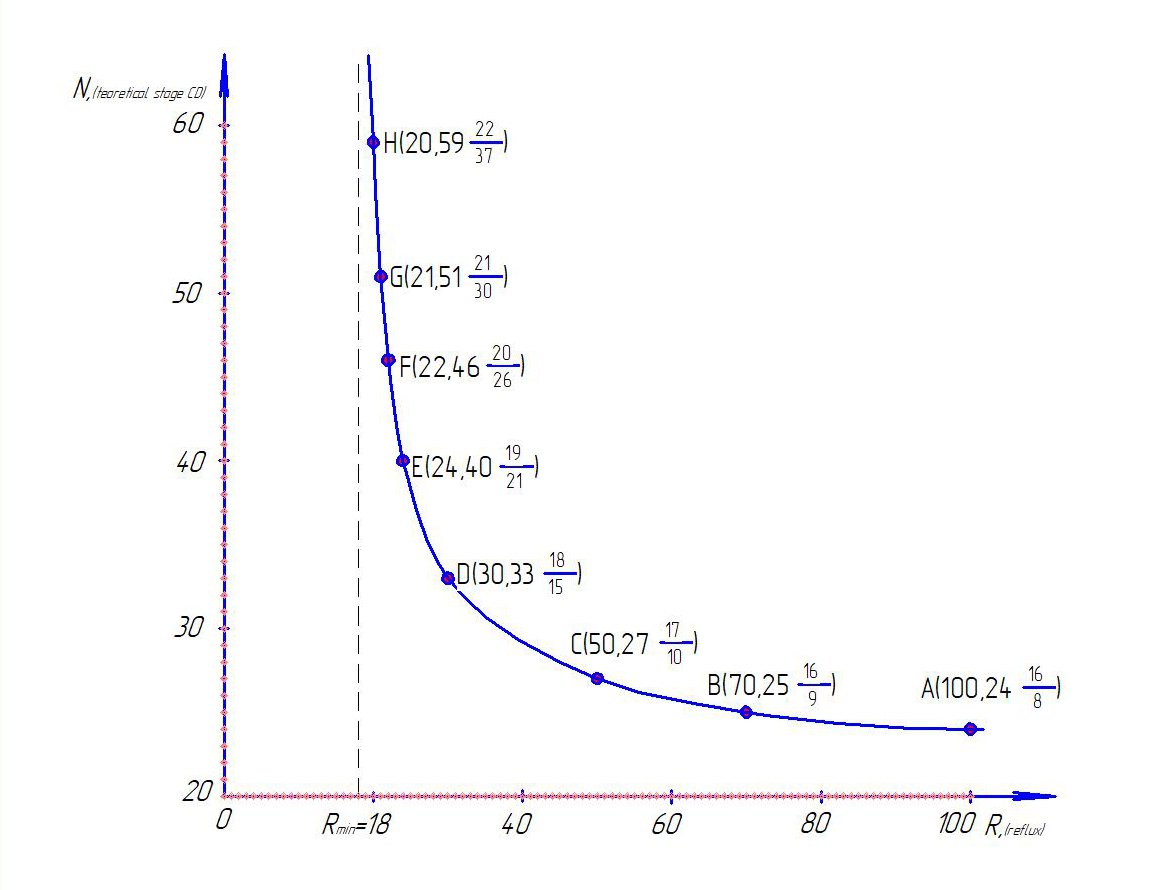
Fig. 4. Dependence of the number of theoretical stages in cyclic distillation on the reflux ratio for a given degree of separation. The coordinates of the points on the curve give the reflux ratio and the number of trays. In this case, the numerator gives the number of trays in the rectification section of the column, whereas the denominator gives the number of trays in the stripping section.
When the reflux ratio is equal to or less than the minimum value, the specified degree of separation is not achieved. In all cases, the operating line has curvature opposite to that of the equilibrium line and lies below the diagonal of the graph. The graphical representation of the cyclic distillation operating lines shows that the minimum number of trays required for a given degree of separation is also attained at an infinite reflux ratio. In this case, the cyclic-distillation operating line is a mirror image of the equilibrium line with respect to the diagonal of the graph. As the reflux ratio changes, the ratio of the number of trays in the rectification and stripping sections of the column also changes.
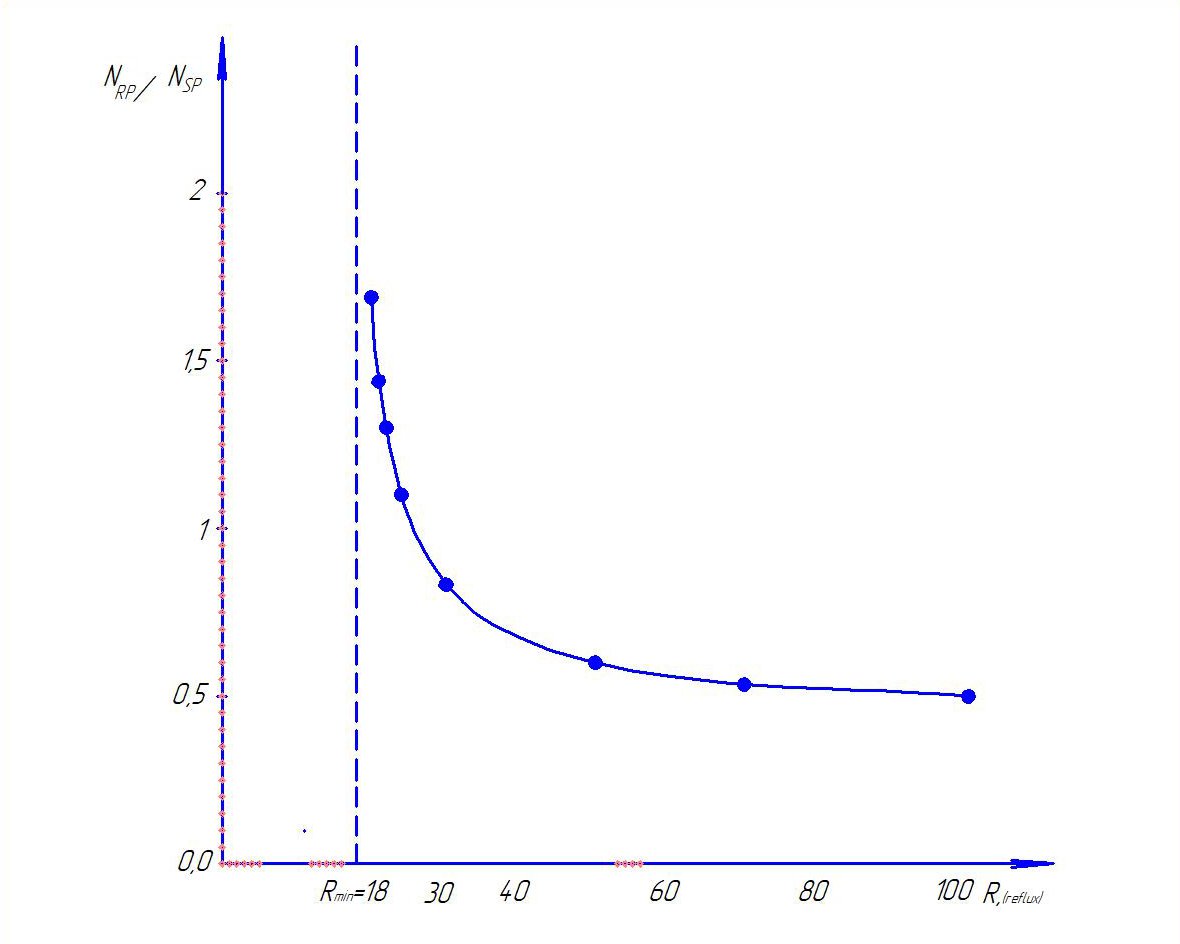
Fig. 5. Distribution of the ratio of the number of trays in the stripping section of the column, Ns, to the number of trays in the rectification section of the column, Nr, as a function of the reflux ratio.
The calculation of the conventional column was performed on the basis of a theoretical-stage model. The simulation results are presented in Fig. 6.
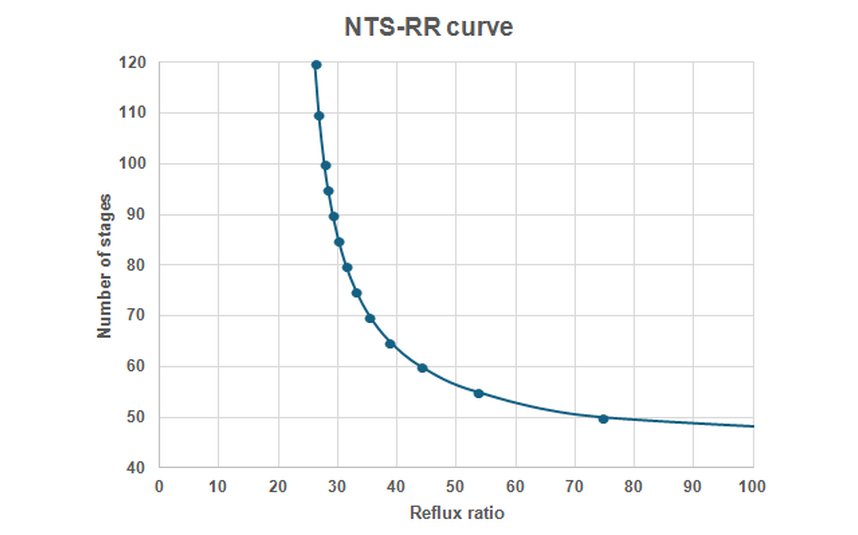
Fig. 6. Dependence of the number of theoretical stages on the reflux ratio at a given degree of separation.
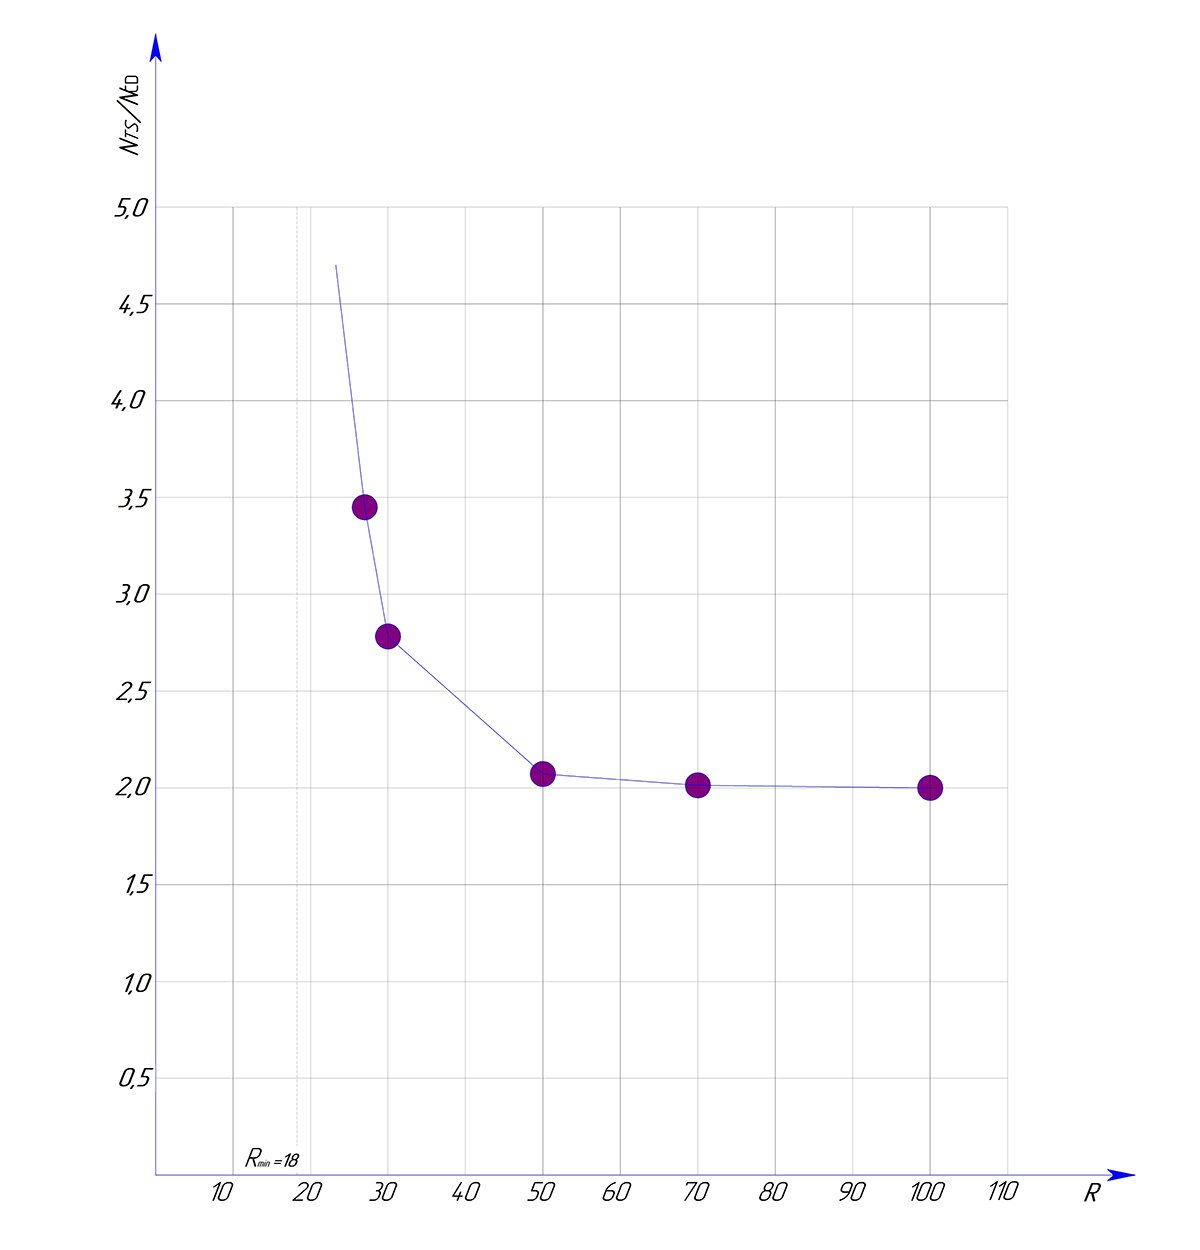
Fig. 7. Ratio of the number of theoretical stages Nt to the number of theoretical stages of
cyclic distillation NC for a fixed reflux ratio.
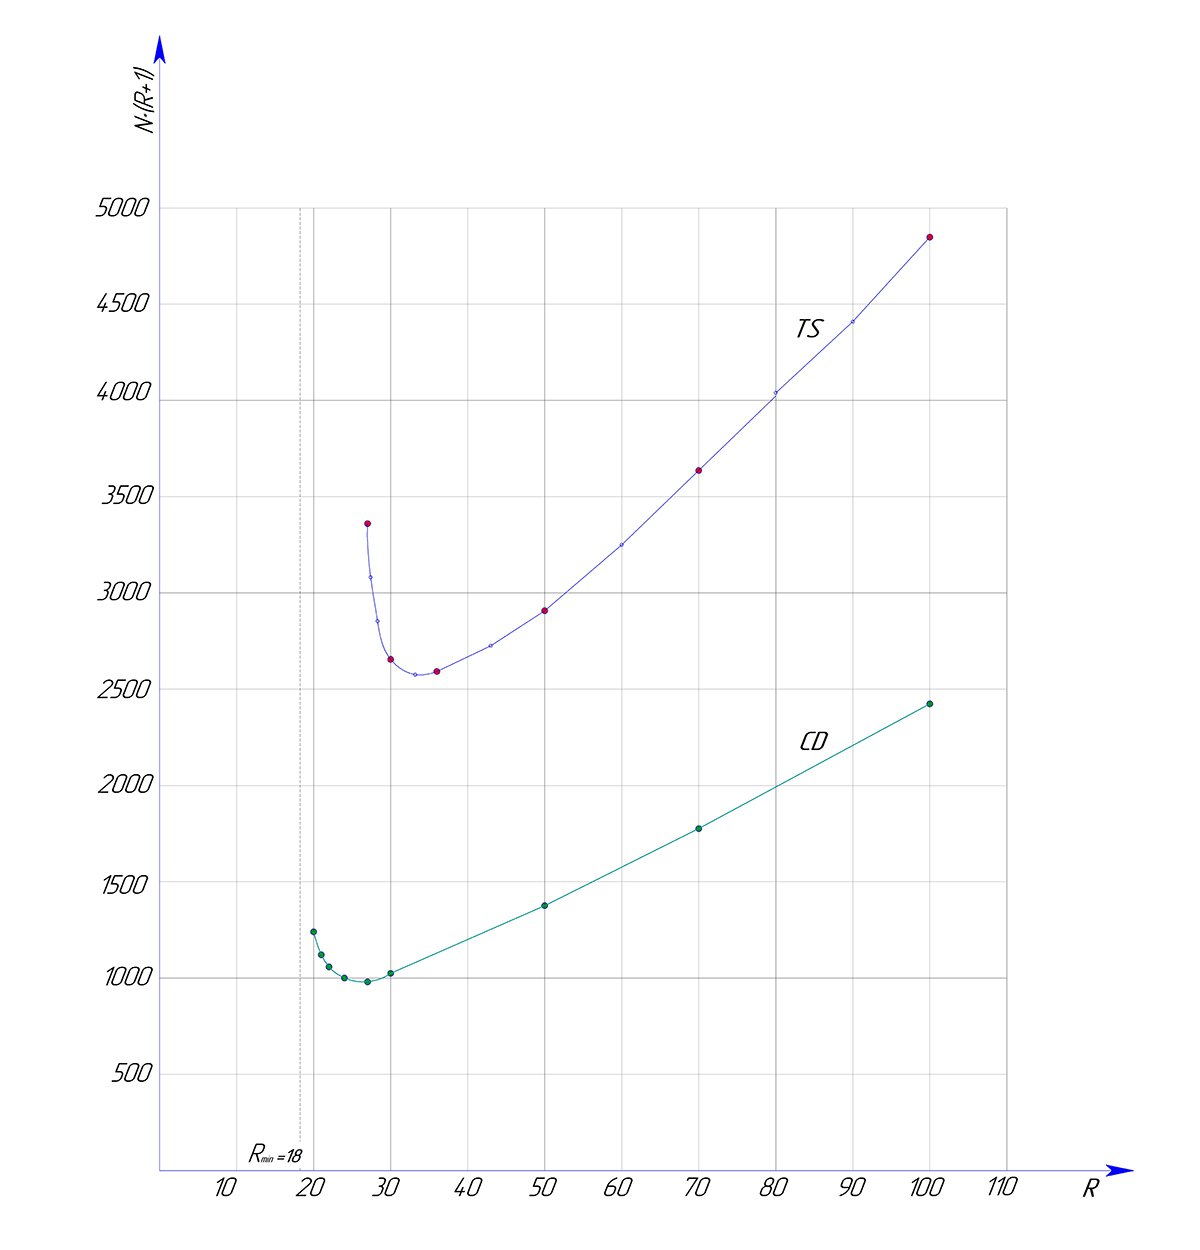
Fig. 8. Comparison of the optimal reflux ratio for the theoretical-stage and cyclic distillation
theoretical-stage models. The minimum point on this graph corresponds to the lowest total cost of manufacturing and maintaining the column and of operating it on a daily basis.
The resulting value of R is taken as the optimal operating reflux ratio.
A comparison of the theoretical-stage and cyclic-distillation theoretical-stage models for calculating distillation columns is shown in Figs. 7 and 8. For a fixed reflux ratio, the ratio of the number of trays in the two models depends on the reflux ratio. The minimum value of this ratio, equal to two, occurs as the reflux ratio tends to infinity. At reflux ratios close to the minimum, this ratio can increase to four. Thus, at equal reflux ratios close to the minimum, the number of trays required for a cyclic-distillation column is four times lower than that required for a conventional column. Moreover, there is a range of reflux ratios near the minimum at which conventional distillation columns can no longer operate, regardless of the number of trays.
For the optimal reflux ratio comparison of the two modes, the investment costs of manufacturing the distillation equipment are expected to be two times lower, while the energy costs are 26% lower.
The qualitative patterns observed in the separation of n-butanol and isobutanol are characteristic of all binary mixtures, whereas the quantitative relationships depend on the physicochemical properties of the substances being separated.